June 2022: New Duplicate & Re-Run setting, Data Table Versioning Updates and Account Setting for Default Date Format

NEW

Option to keep existing table versions upon duplicating or re-running a projection

Users can now create a projection using the same data table inputs and their set version by unchecking the “Set Tables to Latest Version” checkbox found in the confirmation modal of the Duplicate and Re-run Projection actions. By default, Slope updates all configured data tables to the latest version when duplicating or re-running a projection. 

IMPROVEMENTS

The Save Formula button on the Formula Builder will now disable when there are no changes to be saved  

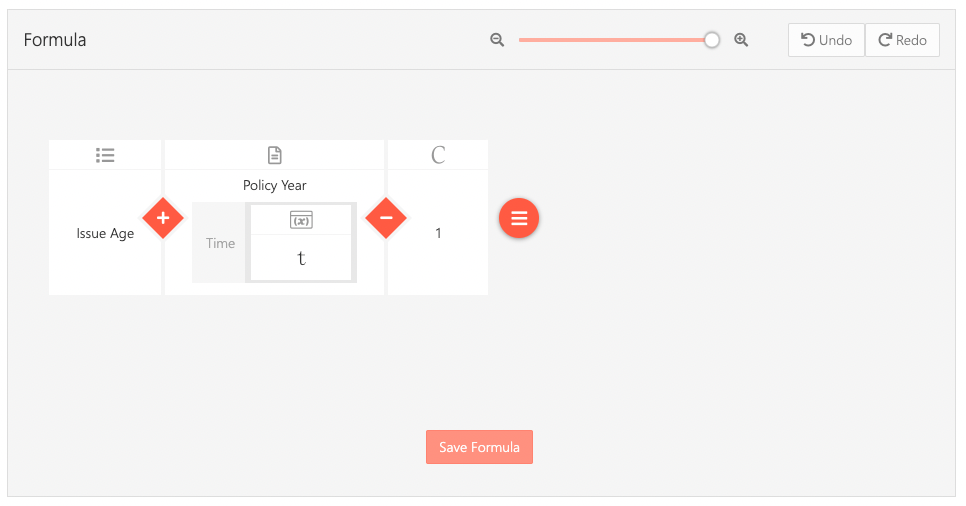
Below is an example of a formula that does not have any unsaved changes and therefore the Save Formula button is disabled. This will prevent unnecessary saving. 

Account Setting for International and Custom Date Format on Model Point Files 

To support our clients using date formats other than MM/DD/YYYY, we can now set a default on the account so that the desired date format for data ingestion doesn’t have to be selected every time a Model Point File is uploaded. Please let us know if you’d like us to modify your default date format.

Data Table Versioning Update 

When a model is copied (e.g. The Slope Life Library) the Data Table versions in the copy will be set to 1 rather than the current version from the copied model. 

FIXES

  • Resolved an issue with deleted table structures that was resulting in an unknown error on Arrays.
  • Restored validation on rolling value and present value variables following merging them into a model.
  • Removed the option to select invalid array mappings in the variable merge dialog. 
  • Added product name suggestions for products that are only referenced by a Sales Allocation or Investment strategy to the suggested values on filters found at the top of dashboards.
  • Corrected the debug url for array variables when a formula contained both a single value array aggregate and an array with array aggregation set to none so that users are brought to the correct variable upon click.

May 2022: SSO & New Authentication, International Dates in Model Point Files & Decrement Table Performance Improvement.

While there are several improvements discussed in this month’s release notes, we want to take one last opportunity to call your attention to the authentication upgrade on May 31, 2022 which will prompt you to reset your password when you attempt to login. Please continue reading for more release updates.

NEW

Updated Authentication and Single Sign On Support

Slope’s new authentication enables us to continue to further protect our application while offering more login options and controls to our clients. One of the immediate benefits of this update is that Slope now supports authentication via Single Sign On. Single Sign On prevents users from having to keep track of another password and gives IT teams greater control over platform access and security.


As a result of this update, the first time you attempt to log into the Slope application on or after May 31, 2022, you will be required to reset your password. If desired, you may set your new password to match your existing password.

International and Custom Date Format Options on Model Point File Uploads

Slope now supports the ingestion of Model Point data with international and custom formatted dates so that clients using these formats don’t need to re-format their Model Point files. You will now see a Date Format drop down on the Product Configuration modal on projections and projection templates. The current default is set to “MM/DD/YYYY, M/D/YY or M/D/YYYY” which was previously the required format for file uploads.

Note: This enhancement will not change the format in which dates are displayed in the application including in the analyze module (currently MM/DD/YYYY). We will continue to work to accept and display international dates in other areas of the platform and will have future updates shortly.

IMPROVEMENTS

Decrement Table Update and Improved Projection Performance

We have improved the decrement table editor and storage so that they are more performant when saving changes and running projections. All existing decrement tables have been updated. 

CHANGES

Formula Editor Text Updates 

The text for “None” on the Array Aggregation method in the formula editor has been updated to provide clarification that it is the same as selecting “Current Array Value”

References to legacy “input table” wording have been updated in the formula editor.

FIXES

  • Improvement Scales will no longer overlap the model list drop down when clicking on the model name in the top left corner of the Improvement Scale Details page. 
  • Added Array Value to the join criteria for the Model Point Comparison Explore to prevent duplication of result values.
  • The investment strategy will once again be included in the copied projection template when a model copy is made.
  • Users will receive an error message that a file is required when they attempt to import a file without selecting a file first.

April 2022: New Dashboard Interface, Improvement Scale Enhancements and API Changes.

This month, we are excited to bring several enhancements including our updated dashboard user interface as well as improvement scale enhancements and API changes. Please note the “Coming Soon” section announcing an authentication upgrade in May which will require you to reset your password.

NEW

Improved Dashboard Interface

Dashboards found in the Analyze module have an updated interface and several usability enhancements.

  • You will now see a single set of filters located and edited within the Dashboard.
  • You will now be notified if you attempt to navigate away from a Dashboard or Tile while making edits.
  • You can now add notes to a Dashboard for documentation and display the notes above visualization, below visualization or on icon hover. 
  • You can now use cross-filtering on a dashboard to click a data point in one dashboard tile and filter the other dashboard tiles on that value. 
  • You will now see a scrollbar for both the left-hand dashboard list and dashboard itself so that each can be scrolled independently. 

IMPROVEMENTS

Improvement Scales

The following capabilities have been added for Improvement Scales:

  • The Improvement Scale column with Improvement Scale ID can now be exported and imported into the Data Table editor.
  • Data Tables with a nested Decrement Table column will now validate that Improvement Scales are not saved without a Decrement Table.
  • Table Structures with nested Decrement Table and Improvement Scale columns can now be merged in Change Management. 
  • Users can now switch between Improvement Scales and Decrement Tables using the drop down list in the top left corner of the Improvement Scale editor. 

New Projection Field on Explores in Dashboards

In addition to the upgraded interface, you will now find a new “Projection” field available in all Explores for easier projection filtering. The new projection field contains both the Projection Name and ID. 

CHANGES

API Updates 

The API will now provide an informational message on the Patch Projection endpoint when the Model Point File is missing. The API will also support the creation of a projection from a template that has Model Point Filters. 

COMING SOON

Authentication Upgrade

In an effort to continue to provide first rate security and offer enhanced security features such as Single Sign On, Slope will be updating our application’s authentication. As a result, when you attempt to log into the Slope application, you will be required to reset your password (as shown below).  If desired, you may set your new password to match your existing password. 

We are currently targeting a go live date of May 31, 2022 (updated) and will send a reminder email several days in advance of the change. 

FIXES

  • The Economic Scenario Generator will now pull the correct US Treasury rates when the “Fetch Rates” button is clicked.
  • The Data Table destination drop down in the Confirm Merge Operation Modal will automatically map Data Tables when one of the options in the drop down is a copy of the same table or uses the same name. 
  • Stability improvements have been made to prevent projection status failures when calculating goal seeks or running a large number of scenarios. 
  • Projections can no longer be modified while running. 
  • Dashboards will consistently save after the dashboard edit screen has been loaded for an extended period of time. 
  • Projection comparison will load successfully when either Projection contains a deleted product definition.
  • The debug view will now consistently load the correct formula when clicking through a single value array. 
  • Resolved an issue with the Copy Dashboard functionality in the Analyze module. 

March 2022: Slope Adds Support for Improvement Scales & New Explore for Comparing Model Points Between Projections.

NEW

Improvement Scales

An example of a generational improvement scale.

Slope now supports both Standard and Generational Improvement Scales for the purpose of applying a decrement improvement rate. Improvement Scales can be created directly within the Slope interface or imported from an excel file. Documentation on how to create an improvement scale and how the improvement rate is applied can be found here.

Improvement scales are configured in the Data Table editor alongside any decrement table with a base year.

Coming Soon: In future releases, users will be able to merge a table structure with a nested decrement table and improvement scale, switch between improvement scales using the drop down list under the improvement scale’s name and see additional validation when editing decrement tables and improvement scales.

New Explore for Comparing Model Points between Projections

The new Model Point Comparison Explore allows users to compare model points between projections for the purpose of identifying differences, including new and terminated model points. This Explore includes both Model Point Fields and Results (variable calculations).

A Left and Right Join Variable Name and Left and Right Projection ID filter is required for this Explore. For the Join Variable Name, select the common variable between your projections’ model points that serves as your unique identifier for comparing data (ex: Policy ID). Then provide the IDs for your two projections in the Left and Right Projection ID filter. Finally, select the fields you wish to display and any filters you wish to apply to the displayed data.  

Note: In Left and Right Variable Results, the Filter only fields filter data before the join occurs. The fields found under Dimensions will filter after the join occurs. 

CHANGES

API Updates

The Post Data Tables and Post Scenario Tables endpoints have been updated to use “name” instead of “description” to match the interface updates. Additionally, the rate limit for the SLOPE API was increased to 10 calls per second. 

FIXES

  • The description from the table structure will again display upon hover over a data column on a data table. 
  • Improved performance for projections that use large data tables with range lower bound lookups. 
  • Empty booleans on data tables will now be treated as false rather than erroring on a projection. 
  • Decrement Tables will import without error when they are used in a nested data table following a versioning event. 
  • Improved Result Writing stability to reduce the need to restart a scenario. 
  • Projection status will no longer fail to update when ‘output all results’ is enabled and the error limit is reached.
  • Improved calculation engine stability to increase projection completion success. 

February 2022: New Snowflake Integration, New Dimension for Reporting on Array Values and additional changes

NEW

Snowflake Data Integration

SLOPE’s integration with Snowflake allows clients to directly access their results data in a secure environment without having to copy, move or reconstruct data (ETL). For more information on this integration, please reach out to your account representative.

IMPROVEMENTS

New Array Value (Numeric) Dimension in the Analyze Module

Model Point, Product, Portfolio and Company Explores now have a new “Array Value (Numeric)” dimension in which Array Values are converted to a numeric value so these results can be sorted in numeric order on dashboards.

CHANGES

Mortality Tables have been renamed “Decrement” tables.

This change is to provide a more comprehensive description of the tables created and edited in this section including the addition of Improvement Scales in a future release.

FIXES

  • Formulas in large models will now save more quickly.
  • The Academy Interest Rate Generator will now generate a file when variable rates are not configured on the Economic Scenario Structure.
  • Projection scenarios are no longer erroneously showing as failed while still running. 

Library Update 2022.1: New Long Term Care Product, ALM Dashboard, and Updates

New Products

  • Long Term Care

Updates

  • US Statutory Valuation Rates Updated through 2022
  • Several Standard Tables were updated to use new default row option logic
  • New Mortality Tables Added to Library
  • Lapse Rate Tables updated to be by Issue Age and Policy Year by default on all products
  • Externally Projected Asset Product Updated to use a central lookup table to support multiples types of EPAs in a single run
  • Gross Premium Calculation Method lookup moved to Run Settings table to more easily allow switching between in-force and pricing runs

New Dashboards

A new ALM Dashboard is available in the System Dashboards > Portfolio folder

Coming Soon

The next library release will include support for several major new pieces of functionality including:

  • US GAAP LDTI
  • IFRS-17
  • Solvency II
  • Bermuda Solvency Capital Requirements

Extra testing effort is being put into this release to ensure that all this new functionality works well with the Library. We are currently targeting a Q2 2022 release.

January 2022: Automatically Saving Variable Properties and Info Sec Updates

Our product development team is hard at work in this new year to bring you all some great new features in the coming months. While several large initiatives are still in the works, we will continue to provide monthly updates on enhancements and fixes in the meantime.

IMPROVEMENTS

Variable Properties Update

The variable properties pane (top), will now automatically save and validate property changes without requiring the click of a save button. This makes it easier to edit the properties and formula simultaneously as clicking save is now only necessary for formula edits.

Information Security Testing and Certification 

We’re currently working on our SOC 2 and ISO 27001 certification with anticipated completion in the first half of 2022. While you won’t see changes to the interface as a result, it’s worth noting we’re dedicating time to rigorous testing and undergoing formal certification to demonstrate our commitment to maintaining first rate information security.

FIXES

  • When a single percentage value is pasted into a cell in the table editor, it will be properly converted to a decimal. 
  • Copying and pasting a single value in the table editor will no longer clear out data in the columns that follow. 
  • Not a number and infinity errors will now be displayed in Run Logs. 

December 2021: C3 Phase I Interest Rate Generator, API and Projection Enhancements.

NEW

In App C3 Phase I Interest Rate Generator

You can now generate economic scenarios using the C3 Phase I Interest Rate Generator from the American Academy of Actuaries and SOA without having to leave the SLOPE application. In-app generation for 12 and 50 standard scenarios is supported with a monthly, quarterly or annual time step.

IMPROVEMENTS

Projections

To allow for greater flexibility on annuity contracts in which valuation rates are specified daily, the Projection Start date can now be any date in the month and is specified as a day, month and year. Time period zero will still occur at the end of the month.

SLOPE API

Example scripts are now available in Java for the Slope API on our GitHub repository available hereThe Projection Patch Error messaging has also been updated to explain when the delimiter does not match the file type. 

Table Editor Improvements

  • The data table version on a table that was copied from an existing table will now be reset to version 1 for the new copy. 
  • Percentages from excel can now be pasted directly into the new table editor without reformatting

Additional Improvements

  • The time period and variable will now reflect the lowest level of information in the run logs for Single Value (formula) variables set to warn. 
  • The current Projection Time record has been added to the Force Recalc Results tables so that all force recalculation results can be viewed in a single table.
  • The Slope filters displayed above a Look in the Execute module will now update when the Looker filters are added or removed and saved within the Look.

FIXES

  • When a data column is added to a table structure and the associated data tables do not have data in the new column, that column will read like an empty result. 
  • Range array index performance improvements have been made.
  • Deleted Data and Mortality Tables will now display in historical versions of tables only. 

November 2021: New Table Editor, Default Values in Data Tables and Economic Scenario Generator Improvements

NEW

New Table Editor

Slope has an updated table editor that now supports in-application editing of up to 100,000 rows and offers greater keyboard support more consistent with excel.

The new editor’s right click context menu offers common actions such as inserting rows and copying and pasting.
  • A few specific improvements of the new table editor include the ability to:
    • Select entire rows/columns by the header for easier copying and pasting.
    • Undo, redo, copy and paste using the right click menu or keyboard shortcuts.
    • Insert rows into the middle of a table.
    • Extend cell selection with shift arrow shortcuts.
    • Check and uncheck actions for boolean fields.

Please note that rows are no longer added in the lower right hand corner of the interface. Instead you can use the left click menu to insert a row or copy and paste multiple blank rows into your table.

Default Values in Data Tables

Empty index values are now valid in the data table editor and will be treated as a default. Clearing out the value in an index field will display the <DEFAULT> label. When the values you are looking up match those specified in the index columns, the values in the matching rows will be used. When the values you are looking up don’t match those specified in the index columns, the rows with default values will be used. This allows you to define a standard value or set of values in non-index columns using <DEFAULT> and then define specific exceptions. 

In the example below, you will see that by default, a commission rate of .05 will be applied unless the plan code and issue year combination matches one of the other specified lookups.

IMPROVEMENTS

Economic Scenario Generator

You can now continue to use the SLOPE application while your economic scenarios are generating in the background. Additionally, we have added the ability to generate up to 10,000 scenarios with a monthly time step to the Academy Interest Rate Generator.

Economic scenario files that are in the process of being generated, will show in grey on the Economic Scenario Table list.

Looks in the Analyze Module

Now when you load a look in the Analyze module, the projection ID will automatically be set to the projection you selected.

Additional Improvements

  • The 1st “Duration (in months)” label in Annuity Factors was updated to “Annuity Length (in months) for clarity.
  • Projection Start Date was added as an option in System Variables and can be used in place of DateOf (Time 0).

FIXES

  • Fetching Treasury Rates is now retrieving rates following an update by the US Treasury.
  • Duplicate options were removed from the System Variable drop down.
  • Referencing “Current Array Value” within a Time formula will now consistently return the correct array value.
  • Merging Array variables that reference table structures from the Slope Library (e.g. Collateral Adjustment variable in the Asset Backed Security product) will now properly merge the Array variable and map the table structure.

October 2021: Auto-Including Tables on Model Copies, Looks, and Projection Enhancements.

NEW

Copy Model: Auto-Include Required Tables

When selecting Products, Portfolios and Projection Templates to include in a model copy, Slope will automatically include the necessary Data Tables and Mortality Tables with the new “Auto-Include Required Tables” toggle enabled.

Upon click of Create Copy, a new confirmation modal will list all of the selected entities, files and automatically included data and mortality tables that will be included in the copy. 

Analyze: Looks for Automated Projection Results

Looks are now available in the Analyze module and allow clients to save a data query with filters and visualization for reuse on multiple dashboards. Looks have been added to the Analyze module so that API clients can retrieve the raw results data file for the Look via the API. To pull the raw data file for a Look, create the look in the interface and pass the Look ID into the POST Reports/Looks endpoint. 

The Look ID needed for the API can be found in the top left corner of the Look. 

Looks can be created using the + button found on the Your Looks and Shared Looks sections of the left hand rail. Looks can also be created from existing Dashboard Tiles by clicking “Explore from Here” found under the context menu (three dots) and then clicking edit and saving as a Look.

For clients not using the API, Looks can still be used within the Analyze module as reusable dashboard components. When the Look is updated, all Dashboard’s that contain the Look are also updated.

IMPROVEMENTS

Projection and Template Updates

Projection templates can now be created from projections so that once the desired settings and inputs for a projection are finalized, they can be turned it into a template for future runs. This functionality is available under the new, consolidated Actions menu found in the top right corner of a projection. 

Data Tables that are referenced by variables excluded by tags in a projection no longer need to be configured to run the projection. These tables which are unnecessary to set due to the variable(s) referencing them being excluded will now appear in an “Unused Tables” section and selecting a table for the structure will be optional in the event the table is indirectly referenced by a variable that is not excluded.

API Updates for Valuation Automation

  • Added table name and version to the Patch Projection endpoint so API users can specify which table to update using table name as an alternative to Data Table ID. 
  • Added the version number next to the latest version of data tables in the SLOPE interface so that it is easy to identify the version number for the API. 
  • Separated the Scenario Tables endpoint into POST and PATCH endpoints for the creation and updating of Scenario Tables.
  • Created a Github repository with sample API Scripts in python available here

To learn more about the SLOPE API, visit our FAQ page. 

Additional Enhancements

  • Slope Library Models are now available as a source for merging for efficiently merging changes and updates into working models. 
  • Model Compare is now identifying changes in before/after investment timing selected on Product Aggregates.
  • Product Aggregate Results (Grouped) explore now returns all results when filters are empty.

FIXES

  • The ID column has been added to the grouped list view of projections found in the Execute module for consistency with the ungrouped view and to align projection metadata (e.g. Model Name) under the proper header. 
  • A data table loading issue has been resolved.
  • Single Value (Formula) variables now reference dynamic array values from the correct time period.