Pivot tables now support the ability to freeze or unfreeze the position of columns.
Search “True” or “False” in Formula Builder to Insert Boolean Formula
You can now search “True” or “False” in the formula builder to quickly insert a Boolean constant with “True” or “False” automatically set as the value.
Fixes
Switching the array in variable properties from a one-dimensional array to a two-dimensional array that contains the original array correctly retains the formula per array value if applicable
The GET projection endpoint is now correctly returning a status when a filter is applied
Data tables are no longer being erroneously created on import when files are missing column names
A new product variable, “06 Advanced COLA – Annual Dollar Amount” has been created. This product variable allows the development of Cost of Living Adjustment formulas that are more complex than a simple rate increase.
An example would be a limit of cumulative COLA to less than 2.5 times the original benefit amount. Other product variables that are compatible with developing these formulas have been assigned the tag “Advanced COLA”. A formula is defined per benefit payment form.
Control of this feature is set in the table structure “Benefit Definition – Payment Form” in the column “Advanced COLA” in which a specific benefit formula to which to apply the Advanced COLA can be selected.
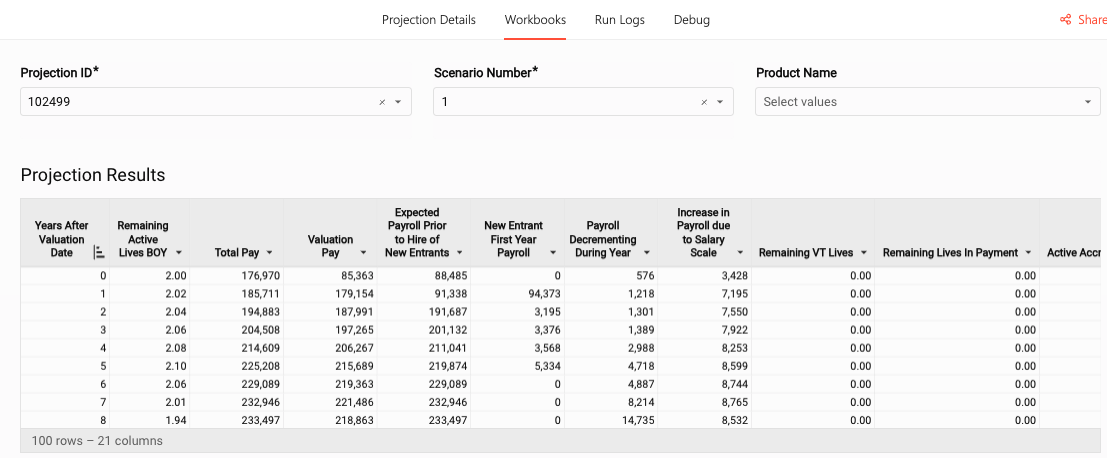
“Pension Trace Life New Entrant” Workbook
The workbook has been created to allow review of calculation details for new entrants in a multiyear projection.
Enhancements
Additional granularity to the configuration of compensation limits
The table structure “IRS and Social Security Limits” is used to configure future and historical compensation limits. Previously this table appeared as a top level configured table for projections. This table has now been nested in the table structure “Valuation Inputs – Plan Definition”. Different tables can now be assigned to different Plan Populations.
“Multi-Year Projection” Workbook has been reconfigured
The workbook has been enhanced to provide additional information around annual compensation and provide service cost rates.
New Entrant Service Cost
The following product variables have been created to allow review of the underlying calculations for new entrants in a multiyear projection
“Service Cost Rate”
“Service Cost PV of Future Comp at Entry”
“Service Cost PV of Benefits at Entry”
Changes and Fixes
Product Variables that began with the prefix “ZZ” or “ZZZ” have been renamed with the prefix changed to “Multi Year”. The variables have also been tagged “MultiYear”.
The following product variables have been modified to fix potential conflicts with certain deferral periods: “Annuity Survival Retiree Healthy”, “Annuity Survival Retiree Disabled” and “Annuity Survival Beneficiary”.
The product variable “Service Years Rounded Attained Age Less Hire Age” has been modified to make the calculations compatible with multiyear projections with new entrants.
The product variable “Alternate Salary Compensation Valuation Date” has been modified and the variable “Alternate Salary Compensation Valuation Date 00” has been created to make the underlying calculations compatible with multiyear projections with new entrants.
The product variable “Age Beneficiary (unrounded) preliminary” has been modified to make the calculations compatible with multiyear projections with new entrants.
Model Lineage Shows the Model Source and Other Details
Model details now include additional information to help keep track of a model’s source and history. The “Copied From” field shows which model was copied to create the model you’re looking at (source). You can link directly to the original model as long as it has not been deleted.
Model details now also include the “Created On” date and the model folder if applicable.
Option to Not Reset Table Version Numbers on Copy
Users now have the option to reset or not reset table version numbers when copying a model. When copying a Library model, this box will be checked by default. All other models have this box unchecked by default so that you maintain table version numbers from the source model.
Show Nested Table Version Numbers When Comparing Tables
Users will now see the version numbers of nested tables when using the Compare Tables tool.
Fixes
Model copies are no longer failing when model permissions are set to Shared with Specific Users
Projections with over 4000 scenarios are no longer failing validation
When changing an array to Calculated Range Array from any other type, values are no longer being incorrectly reset to ‘0’
Memory issues no longer result in Model Point Results not getting written
Portfolio variables with commas in their name can now be selected as the Scenario Source in a Present Value formula or Yield Curve Merge formula for a product variable
A number of changes were made to the IDI product, with the largest being the separation of Best Estimate, US STAT, and US GAAP calculations from each being contained in separate array values for each basis into separate sets of variables for each basis. This provides the ability to exclude a reporting basis using variable tags if the user does not want to run US STAT and/or US GAAP.
In addition, the model has been cleaned up substantially, including a refresh of the disability incidence and termination rate tables within the model.
IDI Changes
Moved array variables based on the Accounting Basis array to separate sets of variables for each basis.
Modified gross premium rates to set rates to 0 after time of premium cessation.
Added a default of $0 premium starting from Age 0 (lower bound) to table Library Premiums to Age 65 (previously named Flat_To65_EP90) in table structure IDI Premium Rates structure to prevent the table lookups from producing errors at younger attained ages.
Moved to a separate variable the reference to the A&H Open Claim Reserve within variable A&H Claim Reserve.
Removed unused Premium Type column from the library example Model Point File
Deleted unused Premium field from Model Point File definition.
The Model Point field for Initial Premium is now optional in the definition since this is only needed for Single Premium policies.
Renamed Claim Age variable to Age Attained on Claim to clarify that it represents attained age while on claim rather than age at claim incidence.
Renamed the Time of Claim Term variable to Time of Claim Expiry to clarify that it represents the time of expiry (i.e. end of benefit period) rather than a term length.
Renamed Incidence Tables table structure to IDI Incidence Tables for clarity.
Renamed table structure Inc and Term Table Lookup to Library Incidence and Termination Table Lookup for clarity.
Renamed misleading data table name from Flat_To65_EP90 to Library Premiums to Age 65 within table structure IDI Premium Rates.
IDI Fixes
All disability incidence and termination rate tables have been updated to correct various issues in the tables’ values.
Revised the Library Incidence and Termination Table Lookup table (previously named Inc and Term Table Lookup) to now contain all occupation classes.
Fixed inconsistencies in the sample IDI Plan Code Table.
Added a condition to several variables to not inappropriately calculate (by setting to zero instead) if irrelevant to the disability status at the projection start date. For example, if a life is Disabled at projection start, then variables specific to Active lives are now set to zero.
Modified variables relating to policies in force such that they only calculate for lives that are active at the projection start date, which is consistent with how these variables are currently used in the rest of the IDI product.
Fixed issues relating to Unearned Premium Reserve calculations for single premium policies. Corrected product variable US STAT Active Life Reserve – Unearned Premium per Policy and the example plan code table to calculate zero Unearned Premium Reserves for single premium business, which is now always assumed to map to Credit in the US STAT Line of Business column in the example Plan Code table.
Fixed an issue where US STAT and GAAP unearned premium reserves were trying to calculate a value after premium payment period ended.
Added missing monthly benefit to the library example Model Point File’s records #3 and #4.
Turned off Always Calculate switches on a number of variables which were causing unintended calculations in certain circumstances.
Added Maximum Coverage Age boundary to the incidence rate variables to prevent them from accidentally calculating incidence rates at unintended ages.
Modified the table within structure US STAT Mortality – Individual Disability Income (IDI) to work for issue years 2021 and beyond. Also, collapsed the table structure to use a Range Lower Bound match type rather than Exact Match.
Added Premiums Per Year alias to the Premium Mode model point field definition to properly capture the column in the sample Model Point File
Corrected variable Reinsurance US GAAP PV YRT Benefits which previously referenced US STAT mortality rather than US GAAP.
Corrected variable Maximum Coverage Age (renamed from Maximum Incidence Age) to reference column Coverage to Age from the Plan Code table rather than Maximum Age. This change was done to be more consistent with the Life Library’s design in that Maximum Age refers to the maximum age for model point processing (including the run off of all disability claims) while Coverage to Age refers to the last age of disability incidence. The variable rename clarifies the coverage period also specifies the last period of active life mortality in addition to disability incidence.
Other Library Changes
Renamed array value AG35 – CARVM-MVRM to AG35-MVRM in array Indexed Annuity US STAT Valuation Method to be consistent with other AG35 methodologies.
Added new Policy Year column to the Policy Load table structure. As a result, UL variables have been modified to account for new structure.
Renamed table structure A&H Incidence Tables to CI Incidence Tables. References in the CI product variables will point to this renamed table.
Other Library Fixes
Added a Zero CSV plan code data table for Term Life so that Term Life runs that exclude US Stat variables do not produce errors.
Best Estimate Cash Flows templates in the Life Onboarding model references the Zero CSV plan code data table (from previous bullet) so that it does not produce an error when being run.
New Slope Academy video covering Intro to Life Library Design and Concepts
We have published a new Slope Academy video (~25 mins split into 4 parts) for new users of the Slope Life Library. This video covers the initial set up of the library model and a quick overview of the basics of the SLOPE platform in the context of the library model. It is useful for new users of SLOPE or those that are new to using the Slope Life Library and want a quick orientation of general design aspects of the library model. This video also provides ideas to reuse for user-created custom models built within the platform.
Coming Soon
Pension Risk Transfer library model
Revamped annuity product in Life Library model combining Fixed and Indexed Annuity products with enhanced deposit-based modeling
Yield Curve Merge Function and Related Enhancements
Yield Curve Merge
The new Yield Curve Merge function combines two yield curves into a single curve. The feature allows you to apply a variable spread at each point along a yield curve. Yield Curve Merge can be found under the Tables section of the formula wheel.
The Yield Curve Merge function takes in two yield curves and combines them using the specified parameters. You can read more about the Yield Curve Merge function and how to set it up in this support article.
Yield Curve and Scenario Table Data Types for Variables
In tandem with the Yield Curve Merge function, we have introduced new “Yield Curve” and “Scenario Table” data types for variables. These additional data types allow you to create variables that return a yield curve or a scenario table. Variables with these data types can be used in the Yield Curve Merge function and in the Scenario Table Lookup function.
Nested Scenario Tables
We now support nested Scenario Tables in table structures. You can define a Scenario Table column within your table structure and perform a lookup to return a scenario table in a variable. Read more about nested tables in this support article.
Updated Scenario Table Lookup Function
The Scenario Table Lookup function now includes an additional “Scenario Source” parameter to specify the source of the scenario table. You have the option to use the Projection Scenario, a Scenario Table Variable, or a Yield Curve Variable. Read more in this support article.
The Present Value formula also uses the Scenario Source parameter when the Yield Curve rate type is selected.
Fixes
Unknown errors are no longer occurring when validating calculated range array set up for dynamic products
Errors are no longer occurring when using a large number of model point filters then uploading a model point file in a projection
Multiyear Projections with New Entrant Capabilities
Multiyear projections now have the ability to accept a new entrant profile and a parameterized policy for future new employees using Dynamic Sales. Learn more here.
Present Value of Accrued Benefits and Service Cost discounted using a yield curve
Projections now have the ability to capture the Present Value of Accrued Benefits as well as the Service Cost (Traditional Unit Credit Accrual) using a full yield curve rather than a single discount rate. Checking the ‘Calculate PV of Accrued Benefits’ box on the Liability Calculation Controls (table) will achieve this.
Enhancements
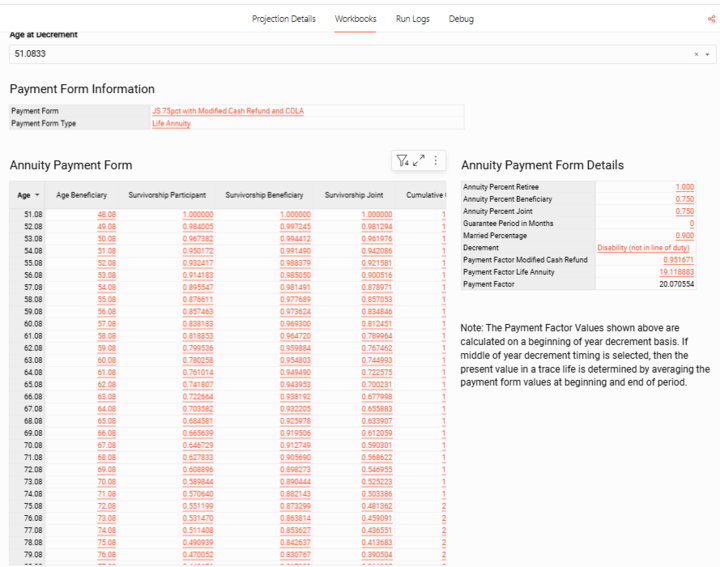
Details of Calculation of Annuity Payment Form Factors is now available in the Active Trace Life Workbook
The details of payment form factors for annuity forms of payment are now detailed and displayed in the active trace life workbook.
Alternate model point field for hypothetical account balance in a Cash Balance plan
A field is now provided on table structure “Plan Structure – Cash Balance or Career Average” to allow a user to pass in an alternate model point field to use as the account balance as of the valuation date.
Ability to provide percentages for the retiree / beneficiary / joint in Joint and Survivor Annuities from alternate model point fields for records in payment at the projection start date
3 new columns have been added in data table structure ‘Retiree Annuity Form Mapping” to allow users to pass in the name of a Model Point Field that contains the percentages necessary to calculate a joint annuity.
Sensitivity Runs for Discount Rates and Salary Scales
A table entry has been provided to allow for different scenarios in the same projection to apply loads to discount rate and salary scale. Standard pension workbooks have been set to filter to the first scenario. A filter has been provided on these workbooks to toggle to different scenarios. Learn more here.
Vested Terminated Records that use Participant Data for Beneficiary Age now reflect that information for Joint and Survivor Benefit Definitions
In projections where the Data Table “Participant Age and Date Logic” have an entry other than “Use Assumptions” in the column “Vested Terminated Beneficiary Age at Valuation”, the marriage assumption will be set to either 0 or 1 for a Vested Terminated record, based on whether the provided field has an entry. This will affect the calculation of Joint and Survivor Annuities as well as death benefits.
Active Trace Life and Pension Liabilities by Definition Workbooks provide Rate of Pay at Valuation
The workbooks for Active Trace Lives and Summary of Pension Liabilities have been modified to provide an additional measurement of compensation. The new field is called “Rate of Pay at Valuation Date”. This field will reflect the reported and annualized compensation for all active employee records at the projection start date regardless if they are at or past their Ultimate Retirement Age.
Trace Life Dashboard now shows details on payment form factor calculations for Life Annuities.
Change
Update to the Projection Limit (time) Variable
Projection Limit (time) will now stop the projection calculations at the later of the time the participant or his/her beneficiary achieves age 115. Previously, projection calculations were terminated at the earlier of the time the participant or spouse achieves age 115.
Fixes
Resolved issue with logic in Retiree Deferred Lump Sum calculation.
The calculation of Present Value of Future Benefits and Entry Age Service Cost will now permit a negative result. These were previously limited to never be less than 0.
We have released some powerful new tools within High Performance Mode to help with troubleshooting models and improving model efficiency
When a projection is able to run in High Performance Mode, you can now enable “Debug Mode” as well. This option will limit your run to a subset of scenarios and model points, and will automatically enable other projection settings necessary for troubleshooting including Output All Results. Read more about HPM Debug Mode here.
Computation Profiling
Computation Profiling is an option for HPM Debug runs that tracks the computations done across variables within a model. This powerful feature can highlight where the model is doing the most work and pinpoint inefficiencies. Profiling also allows you to see the proportion of work done at each variable level and in the main vs. post projection loops. Read more about Computation Profiling here.
Enhancements
Retain Formula Per Array Value in Formula Builder
Within a variable’s properties, you can now seamlessly switch from a static array to a two-dimensional array without losing the formulas per array value. As long at the original array is one of the two dimensions, you can switch and retain all formuals.
Output Model Point Results for Future Time Periods (HPM)
For projections run in High Performance Mode, you can now output future time period results at the model point level.
Minimum and Maximum Aggregation for Product and Portfolio Variables
When referencing a Product array variable within a Portfolio variable, or referencing a Portfolio array variable within a Company variable, there are now the additional “MIN” and “MAX” options for aggregation.
Fixes
Resolved an issue where duplicate results could get written when hardware failures occur
Column in allocation Model Point File is no longer being ignored when the same inforce product does not have the column
Debug View shows the proper time controls when selecting a Force Recalc variable
Debug View again shows results for Force Recalc non-static array value
Improved error message when scaling a model point field fails during new business/investment due to missing model point field
Projection should no longer fail to start while parsing a large scenario file
Model permissions are now more flexible. Users can enable the “Copy” permission for a model along with other combinations of model permissions. For example, you can grant users permissions for “Copy” and “Model Execution”, and “Model Results”. See this support article for more information on model permissions.
Get Projection Endpoint Returns Configured Data Tables
The Get Projection API Endpoint will now return all data tables configured on a given projection. Additionally, there is a new, optional “Fields” parameter which allows you to filter the top-level fields that get returned. We encourage using this parameter to reduce the amount of data being returned and to make your API calls faster.
Links to Sales Allocations from Projection
You can now link directly to a Sales Allocation from a Projection or Projection Template.
Fixes
The selected virtual folders now remains selected after deleting a projection from the folder
Re-uploading a Scenario file to the same folder no longer changes Rate Type and Interpolation Method
Performance optimization to the Get Projection API endpoint
UPDATE: Important information about new warnings and errors on your models.
On September 25th, we released a new validation feature related to calculated range arrays used in formulas. This validation is designed to prevent users from accidentally projecting range array values that don’t exist at certain time periods. Following the next Slope Library Update (ETA November), these validation warnings will become errors for Cores and HPM Projections. See this post for more information and contact us at support@slopesoftware.com with any questions.
REMINDER: Important information about new warnings and errors on your models.
On September 25th, we released a new validation feature related to calculated range arrays used in formulas. This validation is designed to prevent users from accidentally projecting range array values that don’t exist at certain time periods. On October 23rd, these validation warnings become errors for Cores and HPM Projections. See this post for more information and contact us at support@slopesoftware.com with any questions.
Enhancements
Better Searching in Formula Builder
It’s now easier to find the functions you need in the Formula Builder. We have added several new keywords to help build your formulas faster. For example, looking for the “Minimum” function? Search “Minimum” to find the “Aggregate (Minimum)” function.
Set Specific Module Permissions on a Model Shared with Everyone
For models that are shared with everyone, permissions can now be configured for individual modules (e.g. Model Development or Assumption Management). This granularity allows you to quickly enable and disable access for specific modules for all users in the workspace providing more efficient and granular control.
Aggregate Product Level Range Array Variables at the Portfolio Level
It is now possible to reference a product variable that’s aggregated and uses a product level calculated range array within a portfolio variable.
Additional Enhancements
Searching is now supported in the list of Table Structures so you can type in the name of a table structure to filter down the list.
The selected Table Structure will now show as highlighted in grey in the Table Structure list.
Links to Investment Strategies now show on projections for ease of navigation
Data Table columns in a Table Structure will show the Table Structure name of the nested table on hover
Older versions of scenario tables can be selected in scenario table columns in table structures
Fixes
We are now correctly ignoring non-required model point fields that are set to scale on purchase or sale when issuing new business
Model Point Files are no longer being marked as “not validated” when they are moved in file manager
We are again correctly validating a formula when it has a one dimensional array set in the properties and an invalid reference to Dimension 2 in the formula
We fixed a formatting issue when viewing formulas from the Table Structure Relationship View
Resolved an issue with newly introduced validation that resulted in a temporary result discrepancy on pension projections that used range arrays run on Thursday, September 26.
Please read this important communication as you may soon start to see new warnings and errors on your models.
On September 25th, we will be rolling out a new validation feature related to calculated range arrays used in formulas. This validation is designed to prevent users from accidentally projecting range array values that don’t exist at certain time periods. Today, if you don’t use an array aggregation and you project backwards or forwards in time, you might cause certain array values to be calculated when those array values didn’t previously exist at the referenced time period.
When this validation goes live, you may see some additional warnings in your Cores projections. Initially, these warnings will not prevent you from running your projections. You will have until October 23rd to resolve these warnings. After that, we will enforce these warnings as errors. Note that warnings will only be visible for projections run using Cores, but errors will show in Cores and High Performance Mode.
September 25th: New validation warnings for Cores Projections
October 23rd: Validation warnings become errors for Cores and HPM Projections
Why are there errors in a model that I copied from the Slope Library?
The Individual Disability Income product in the Slope Life Library (versions 2024.03 and earlier) contains variables that use calculated range arrays, project forward or backward, and do not use array aggregation. A new version of the Slope Life Library (2024.10) will be published in October with a modification to the Individual Disability Income product. Once it’s released, you can use the Governance module to merge these changes from the new Slope Library model to your models.
What sort of formula will cause this warning/error?
Formulas that use calculated range arrays and incorrectly project backwards or forwards to time periods where the current array value doesn’t exist may start to see these validation messages.
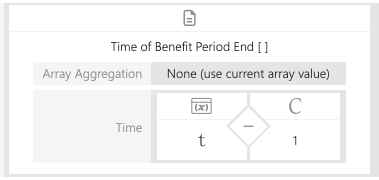
Example
Below is a section of the Time in Benefit Period End variable formula where the array set in the variable properties is a Calculated Range Array. Today, this setup will not cause an error, but it may calculate array values that don’t exist for a given time period. With the new validation, this will result in a warning, and eventually an error.
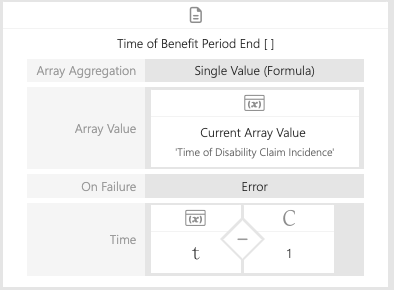
For demonstration purposes, if we modify this formula to use a Single Value (Formula) aggregation, we can replicate the behavior of the new validation we will be rolling out. With this set up, if the formula encounters an array value that doesn’t exist at the given time, it will (correctly) error.
What do I need to do in the short term?
When the new validation goes live, you may start to see new warnings on projections run using Cores. We suggest you resolve these warnings before they become errors on October 23rd.
Why don’t I see warnings in HPM?
Warnings are not currently supported for High Performance Mode runs. When the validation begins, you will only see warnings if you run your model using Cores. After October 23rd, the warnings will become errors. The errors will be visible whether you run a projection in Cores or HPM.
If you have any questions, or if you need help updating your model, please reach out to us at support@slopesoftware.com.