NEW
In App C3 Phase I Interest Rate Generator
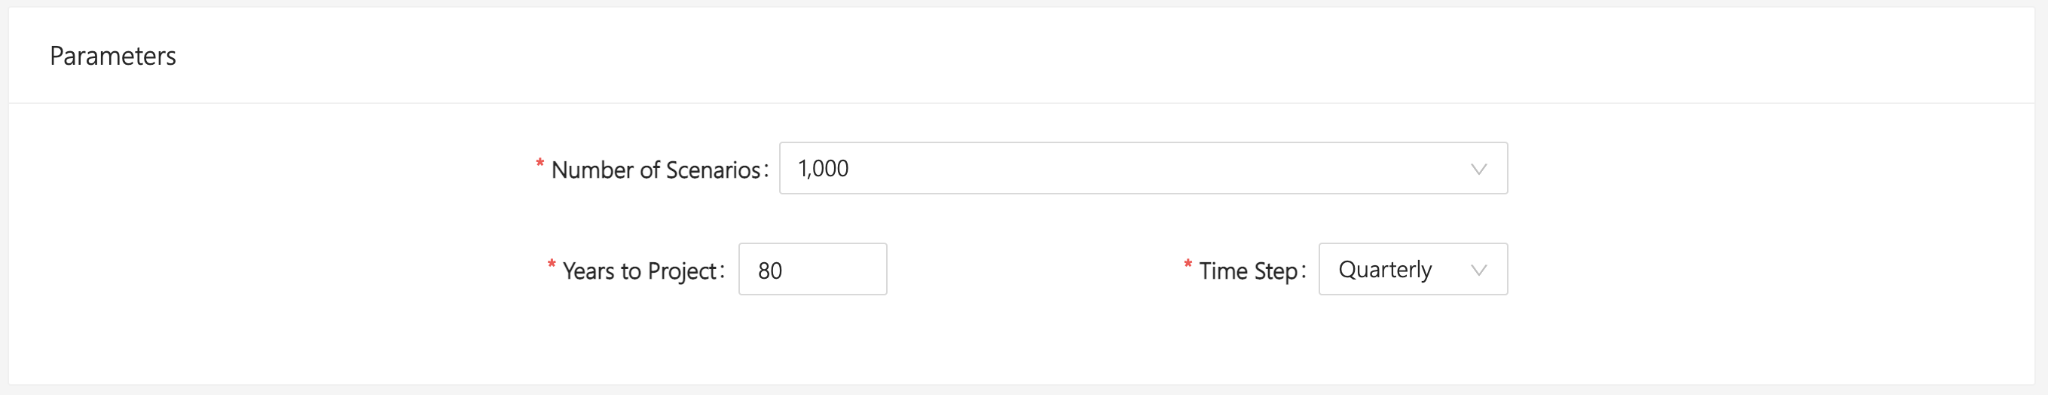
You can now generate economic scenarios using the C3 Phase I Interest Rate Generator from the American Academy of Actuaries and SOA without having to leave the SLOPE application. In-app generation for 12 and 50 standard scenarios is supported with a monthly, quarterly or annual time step.

IMPROVEMENTS
Projections
To allow for greater flexibility on annuity contracts in which valuation rates are specified daily, the Projection Start date can now be any date in the month and is specified as a day, month and year. Time period zero will still occur at the end of the month.
SLOPE API
Example scripts are now available in Java for the Slope API on our GitHub repository available here. The Projection Patch Error messaging has also been updated to explain when the delimiter does not match the file type.

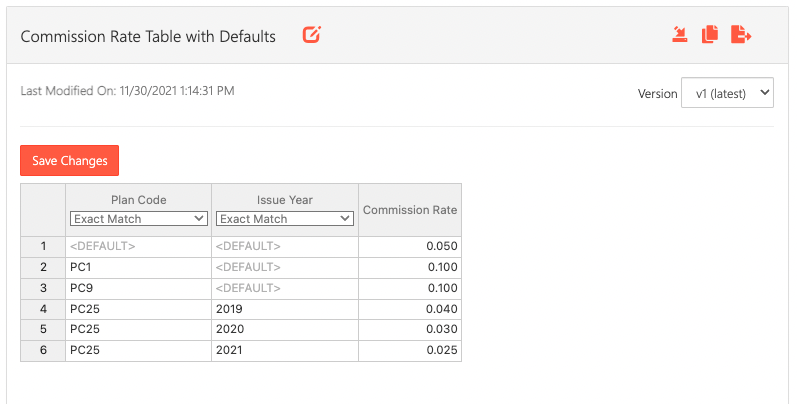
Table Editor Improvements
- The data table version on a table that was copied from an existing table will now be reset to version 1 for the new copy.
- Percentages from excel can now be pasted directly into the new table editor without reformatting
Additional Improvements
- The time period and variable will now reflect the lowest level of information in the run logs for Single Value (formula) variables set to warn.
- The current Projection Time record has been added to the Force Recalc Results tables so that all force recalculation results can be viewed in a single table.
- The Slope filters displayed above a Look in the Execute module will now update when the Looker filters are added or removed and saved within the Look.
FIXES
- When a data column is added to a table structure and the associated data tables do not have data in the new column, that column will read like an empty result.
- Range array index performance improvements have been made.
- Deleted Data and Mortality Tables will now display in historical versions of tables only.