We are writing to inform you of an upcoming platform change that requires your attention.
What is changing
Our reporting vendor, Sigma, is ending support for the current datasets that are used to connect all workbooks to the data warehouses and requiring a migration to a new data model layer. This will affect all workbooks and reports that reference any projection output in SLOPE. We expect that most workbook references will update automatically and you will see no impact from this change, but some may require further modifications after the migration.
What we will handle
Our team will be handling the migration of all Slope datasets to the new data models, using Sigma’s auto-migration tool. We will update all Slope system workbooks as part of the migration. No action is needed from you for those.
What to keep an eye out for
We recommend you review any workbooks that your team has built following the migration on August 24th, in case any updates are needed. This includes all workbooks in your company workspace or in the My Documents folder of the reporting module. More detail about working with data models will be shared at a later date.
How to review your workbooks:
Log into Slope after the migration
Open your custom workbook
Check that all data references and visualizations are loading correctly
Identify and resolve any broken references or errors
If you need assistance with your workbook, contact Slope Support with a link to the workbook and a description of the error. Ensure that the workbook is saved in a shared folder.
Migration timing
The migration is scheduled for August 24, 2026.
We will not know which workbooks may need updates before the migration runs. We recommend blocking off a little time in your team’s schedule on or shortly after August 24th to complete this review.
If you have any questions in the meantime, do not hesitate to reach out to Slope Support.
June brought meaningful additions across access control, API capabilities, and everyday usability — plus a solid round of reliability improvements to keep your projections running smoothly.
✨ New Features
Granular Model Permissions Slope now includes a dedicated Model Permissions permission that can be granted independently of Model Development access. This gives administrators finer control over who can manage permissions on a given model — without needing to grant full development rights. Users with only this permission can access a model’s permissions page directly from the model list. A built-in safeguard also prompts users before they accidentally revoke their own access.
🔧 Enhancements
Full Decimal Values on Older Data Table Versions When reviewing older, non-editable versions of a data table, you can now hover over any cell to see its full precision value — handy for audit and review workflows.
Variable Copy Link Improvements The “Copy link to variable” icon now appears when hovering anywhere in the Variable Properties header (not just over the title text). Clicking it shows a confirmation message, and the icon has been updated to match Slope’s other copy icons.
Drag & Drop Indicator for Model Folders Hovering over a model in the model list now reveals a drag handle icon, making it clear that models can be dragged into (or out of) folders.
Improved Error Messaging Tenor-related errors in the Scenario Table Read function now correctly reference “Tenor” instead of the outdated “Duration” label. Additionally, scenario lookup errors now return more descriptive messages when a scenario table is missing a time 0 entry.
UI Refinements A handful of smaller but impactful polish updates:
The Array modal for Portfolio-level Data Table arrays no longer includes text about “Model Point Aggregation method,” which doesn’t apply at the portfolio level.
Field names in the Change Management merge view now display in a human-readable format.
The Confirm Merge button is now disabled while its confirmation modal is still loading.
The click target for the edit icon on Data Tables in the projection inputs panel has been enlarged for easier use.
A “Back to List” navigation option now exists on Improvement Scale details, to be consistent with Decrement Tables.
Clicking a download icon no longer unintentionally opens an edit modal in some views.
When viewing a model that lives inside a folder, you’ll now see its full folder path displayed in the model details
API Enhancements
Expanded CSV Row Limit for Scenario Table Uploads The scenario table API endpoint now supports CSV uploads of up to 2 million rows (up from the previous limit). For very large files, you can optionally skip validation on upload — validation will then run automatically when a projection is executed. Excel (.xlsx) row limits remain unchanged.
🛠 Fixes
Resolved an issue where projections could intermittently stall or fail to complete when running with a higher number of scenarios. As a result of this stability fix, we’ve also increased the max number of HPM scenarios to 200, and are continuing to work to increase this further.
Addressed a rare race condition that could cause model point values to be double-counted across two adjacent time periods in large projections.
Fixed an issue where Goal Seek formulas configured with an “On Failure” fallback would error instead of applying the fallback when the maximum iteration count was reached.
Corrected the sort order used by the NAIC Scenario Generator when applying the Significance Value subset method, aligning with NAIC documentation.
Improved projection worker stability and performance, reducing intermittent failures during high-parallelism runs.
Corrected an issue where sequential seed values in the Random Number Generator formula produced predictable, non-random results.
Resolved an issue where large file-only data tables with parsing errors could cause a projection run to hang indefinitely instead of returning an error.
Fixed an issue where hyperlinks created in Model Documentation were not clickable after saving.
Fixed an issue where adding a hyperlink in Variable Documentation applied the link to all text rather than just the selected portion.
Corrected a display issue in the Model Point File Filters modal that showed an unexpected element on completed projections.
Fixed a problem where the Sales Allocation dropdown in the Edit Portfolio Details modal appeared empty after saving without a portfolio selected.
Resolved an issue where deleting a data table did not warn users if an older version of that table was referenced in a projection template.
Fixed a validation gap that allowed model point definition merges containing duplicate field names or aliases.
Corrected array variable bracket display in the Relationship View — brackets now appear consistently on both upstream and downstream array variables.
Fixed an issue where attempting to delete a model with a running projection showed an ambiguous confirmation dialog instead of a clear warning.
Fixed an issue where data table dropdown columns would error when the selected value contained leading or trailing whitespace.
May was a productive month across the platform, with meaningful improvements to how modelers handle Goal Seek failures, compare models, and work with large data tables. Rounding things out were a number of performance improvements and a solid round of fixes to keep things running smoothly.
✨ New Features
Goal Seek “On Failure” Handling
The Goal Seek formula now includes an On Failure parameter, giving modelers more control over what happens when a goal seek can’t be solved. Instead of always causing an error, you can now choose:
Error – the existing behavior; the formula errors.
Warn – the model continues using a fallback value, and a warning is written to the run logs.
Ignore – the model continues silently using the fallback value.
When using Warn or Ignore, you can select a Default Value of either the Closest Iteration (the nearest value found during solving) or a Defined Value of your choosing.
🔧 Enhancements
Data Table Content Differences in Compare Models The Compare Models view now surfaces differences in data table contents, not just structure. When two tables have differing data, a “Data” field will appear indicating that differences exist — with a direct link to the Compare Tables view. For file-only tables, the file name difference is shown instead.
Support for File-Only Data Tables Greater Than 2GB File-only data tables larger than 2GB can now be used in projections without errors in the calculation engine. This unlocks the ability to perform lookups on very large datasets that were previously unsupported.
Goal Seek Error Details for Max Iterations (HPM / Debug / Cores) When a goal seek fails due to reaching the maximum number of iterations (as opposed to general non convergence), the error details now include the last two iteration values attempted. This gives modelers the information they need to fine-tune their settings and resolve convergence issues faster.
Improved Scenario File Error Messaging When a scenario file contains an issue, error messages now identify which scenario file is the source of the problem. This is especially helpful when a projection uses multiple scenario files, such as when yield curves are involved.
Multi-Scenario Projection Performance Improvement The finalization steps for projections with a high number of scenarios has been significantly optimized, reducing what was previously a multi-minute wait to a much faster experience.
🛠 Fixes
Fixed an issue where using the models dropdown from within a Model Development page would result in an error page when selecting a production model.
Fixed an issue that unintentionally re-introduced case-sensitivity in xlsx files in the calc engine, causing parsing errors.
When the Subset Count formula in a Rolling Value resolves to a non-positive number, the system now returns a clear, descriptive error rather than a generic unknown error.
The system now correctly detects and reports an error at validation time when a product output grouping is configured with an array variable, preventing errors in HPM, and product groupings results that simply used the first array value in Cores. This setup is not allowed.
The right-click context menu for virtual folders on the Projections page no longer gets cut off at the bottom of the screen when the page doesn’t scroll.
Resolved a rare race condition that could cause product aggregate results to be inserted twice, slightly skewing HPM product aggregate results.
The Seed Value field (for the random number generator) now renders correctly immediately after saving, without requiring a secondary edit to display properly.
Folder dropdowns (used when creating, editing, or copying models) now scroll correctly when there are a large number of folders, making all folders accessible.
Resolved an intermittent failure in the scenario preparation step that could cause projections to fail under certain conditions.
Fixed an issue where projection run logs would reference worksheet names from an old scenario file version after the file had been replaced with a new one, causing false errors.
The projection run log no longer shows “Starting Execution” multiple times for projections with many scenarios in HPM.
April was a packed month! The big headline is the arrival of Model Documentation — a long-requested feature that gives model developers a dedicated space to document their work. We also shipped some meaningful formula-level additions, improved the model comparison experience, and squashed a solid round of bugs. Read on for the full rundown.
🆕 New Features
Model Documentation
Summary: Models now have a dedicated documentation page where developers can capture notes, context, and supporting files alongside their work.
Each model now includes a Model Documentation page accessible from the model details and the model context menu. The page features a rich text editor for structured documentation, the ability to attach files from the File Manager, and a tracked timestamp showing who last updated the documentation and when. Documentation carries over when copying a model. Documentation on Production models is read-only to preserve auditability. See an example of the power of these capabilities on our latest published Pension library model.
Seeded Random Number Generation
Summary: Models can now produce fully reproducible results by setting an optional seed value on the Random Number Generator formula.
A new optional Seed Value setting has been added to the Random Number Generator formula. When a consistent seed is provided, the same set of random numbers will be generated consistently across projection runs, making it much easier to validate and audit stochastic models. When no seed is set, behavior is unchanged. Note that in order to generate a unique seed per scenario, per time, or per model point number, those variables need to be included in the Seed formula.
🔧 Enhancements
Ranked Subset Support for Rolling Value
Summary: The Rolling Value formula now supports ranked subsets — Highest N or Lowest N — giving actuaries more precise control over rolling calculations.
The Rolling Value formula has been expanded with two new capabilities. First, the Frequency parameter is now a formula builder input (rather than a fixed dropdown), allowing for dynamic frequency expressions. Second, a new Subset option lets you filter the rolling window to only the Highest N or Lowest N values, with control over whether those values must be contiguous or can be selected freely from across the window.
Projections List Pagination
The All Projections and My Projections list views are now paginated, reducing load times — especially for customers with a large number of projections. Pagination applies when browsing both the top-level list and individual virtual folders.
Delete Individual Array Values When Comparing Models
When comparing models, you can now merge individual or multiple static array value deletions from a source model into the target — giving you finer-grained control during the merge process.
Improved Yield Curve Point Matching in Model Compare
Previously, if a yield curve point existed in both models with the same duration but different names, the comparison incorrectly flagged it as an addition and deletion. The comparison now matches yield curve points by duration, and name differences are shown as a standard mergeable diff.
Smarter Nested Table Handling When Copying Models
When copying a model with a nested table reference to an older version — and the latest version of that table isn’t used elsewhere — the copy will now correctly include all referenced versions, not just the latest.
🐛 Fixes
Projection file references updated correctly — Switching a model point file from one format to another (e.g., XLSX to CSV) now takes effect on the next projection run as expected.
Table lookup errors resolved — A specific combination of nested and non-nested table references was causing an incorrect table to be cached, leading to lookup failures (which caused errors). This has been corrected.
Scenario table versioning fixed — When a projection uses multiple scenario tables via nesting, all tables now version correctly upon update, rather than only the first one being versioned.
Scenario files can now be deleted after creation — Recently generated scenario table files were not being removed from the File Manager upon deletion. This has been resolved.
Excel model point file parsing corrected — Certain Excel MPFs with stripped dimension tags were not being processed during projections. These files now parse correctly.
Model copy reliability improved — An issue causing model copies to fail when saving files was identified and resolved.
HPM projection improved stability — A rare condition where HPM workers would stall, causing a projection to hang has been addressed.
Scenario log error messages no longer cut off — Full error messages are now displayed in Cores scenario logs.
Debug dropdown alignment corrected — A minor visual misalignment between the array dropdown and array symbol box in Debug view has been fixed.
API Fixes
Data table indexReadMethod now validated — The API now returns a 400 error when an invalid indexReadMethod value (anything other than 1 or 2) is provided in data table requests, rather than silently creating a malformed table.
Scenario table ID returned correctly — The GET /api/v1/DataTables/Data endpoint now returns the correct scenario table ID instead of null for data table columns backed by a scenario table.
A new product variable, “06 Advanced COLA – Annual Dollar Amount” has been created. This product variable allows the development of Cost of Living Adjustment formulas that are more complex than a simple rate increase.
An example would be a limit of cumulative COLA to less than 2.5 times the original benefit amount. Other product variables that are compatible with developing these formulas have been assigned the tag “Advanced COLA”. A formula is defined per benefit payment form.
Control of this feature is set in the table structure “Benefit Definition – Payment Form” in the column “Advanced COLA” in which a specific benefit formula to which to apply the Advanced COLA can be selected.
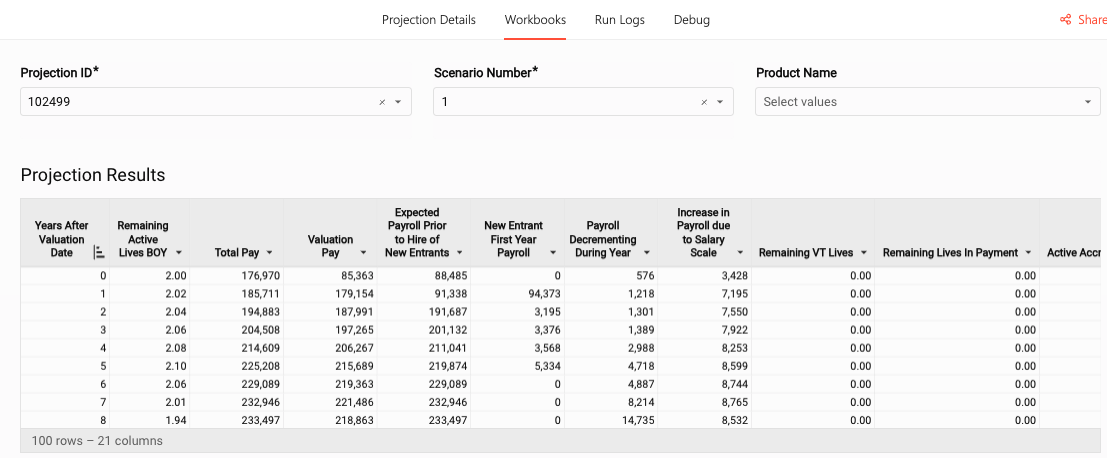
“Pension Trace Life New Entrant” Workbook
The workbook has been created to allow review of calculation details for new entrants in a multiyear projection.
Enhancements
Additional granularity to the configuration of compensation limits
The table structure “IRS and Social Security Limits” is used to configure future and historical compensation limits. Previously this table appeared as a top level configured table for projections. This table has now been nested in the table structure “Valuation Inputs – Plan Definition”. Different tables can now be assigned to different Plan Populations.
“Multi-Year Projection” Workbook has been reconfigured
The workbook has been enhanced to provide additional information around annual compensation and provide service cost rates.
New Entrant Service Cost
The following product variables have been created to allow review of the underlying calculations for new entrants in a multiyear projection
“Service Cost Rate”
“Service Cost PV of Future Comp at Entry”
“Service Cost PV of Benefits at Entry”
Changes and Fixes
Product Variables that began with the prefix “ZZ” or “ZZZ” have been renamed with the prefix changed to “Multi Year”. The variables have also been tagged “MultiYear”.
The following product variables have been modified to fix potential conflicts with certain deferral periods: “Annuity Survival Retiree Healthy”, “Annuity Survival Retiree Disabled” and “Annuity Survival Beneficiary”.
The product variable “Service Years Rounded Attained Age Less Hire Age” has been modified to make the calculations compatible with multiyear projections with new entrants.
The product variable “Alternate Salary Compensation Valuation Date” has been modified and the variable “Alternate Salary Compensation Valuation Date 00” has been created to make the underlying calculations compatible with multiyear projections with new entrants.
The product variable “Age Beneficiary (unrounded) preliminary” has been modified to make the calculations compatible with multiyear projections with new entrants.
Multiyear Projections with New Entrant Capabilities
Multiyear projections now have the ability to accept a new entrant profile and a parameterized policy for future new employees using Dynamic Sales. Learn more here.
Present Value of Accrued Benefits and Service Cost discounted using a yield curve
Projections now have the ability to capture the Present Value of Accrued Benefits as well as the Service Cost (Traditional Unit Credit Accrual) using a full yield curve rather than a single discount rate. Checking the ‘Calculate PV of Accrued Benefits’ box on the Liability Calculation Controls (table) will achieve this.
Enhancements
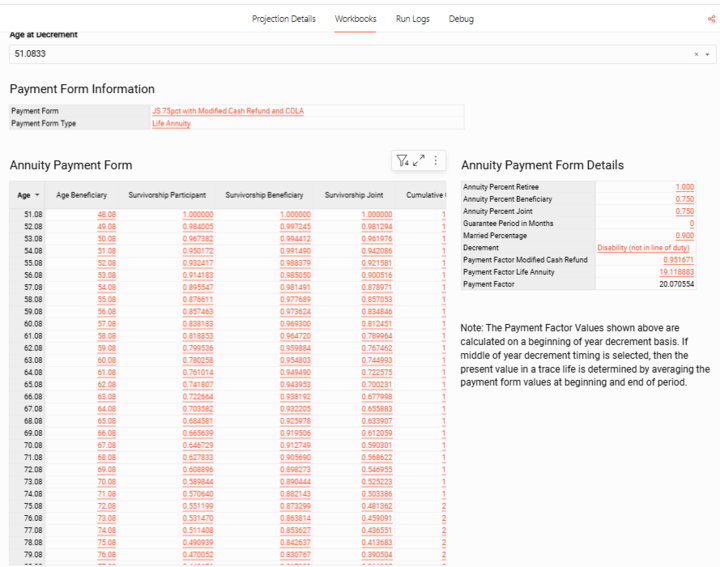
Details of Calculation of Annuity Payment Form Factors is now available in the Active Trace Life Workbook
The details of payment form factors for annuity forms of payment are now detailed and displayed in the active trace life workbook.
Alternate model point field for hypothetical account balance in a Cash Balance plan
A field is now provided on table structure “Plan Structure – Cash Balance or Career Average” to allow a user to pass in an alternate model point field to use as the account balance as of the valuation date.
Ability to provide percentages for the retiree / beneficiary / joint in Joint and Survivor Annuities from alternate model point fields for records in payment at the projection start date
3 new columns have been added in data table structure ‘Retiree Annuity Form Mapping” to allow users to pass in the name of a Model Point Field that contains the percentages necessary to calculate a joint annuity.
Sensitivity Runs for Discount Rates and Salary Scales
A table entry has been provided to allow for different scenarios in the same projection to apply loads to discount rate and salary scale. Standard pension workbooks have been set to filter to the first scenario. A filter has been provided on these workbooks to toggle to different scenarios. Learn more here.
Vested Terminated Records that use Participant Data for Beneficiary Age now reflect that information for Joint and Survivor Benefit Definitions
In projections where the Data Table “Participant Age and Date Logic” have an entry other than “Use Assumptions” in the column “Vested Terminated Beneficiary Age at Valuation”, the marriage assumption will be set to either 0 or 1 for a Vested Terminated record, based on whether the provided field has an entry. This will affect the calculation of Joint and Survivor Annuities as well as death benefits.
Active Trace Life and Pension Liabilities by Definition Workbooks provide Rate of Pay at Valuation
The workbooks for Active Trace Lives and Summary of Pension Liabilities have been modified to provide an additional measurement of compensation. The new field is called “Rate of Pay at Valuation Date”. This field will reflect the reported and annualized compensation for all active employee records at the projection start date regardless if they are at or past their Ultimate Retirement Age.
Trace Life Dashboard now shows details on payment form factor calculations for Life Annuities.
Change
Update to the Projection Limit (time) Variable
Projection Limit (time) will now stop the projection calculations at the later of the time the participant or his/her beneficiary achieves age 115. Previously, projection calculations were terminated at the earlier of the time the participant or spouse achieves age 115.
Fixes
Resolved issue with logic in Retiree Deferred Lump Sum calculation.
The calculation of Present Value of Future Benefits and Entry Age Service Cost will now permit a negative result. These were previously limited to never be less than 0.
Export Variable Properties and Formulas for Model Documentation
Users can now extract a list of their variables with the properties, tags, documentation, formula, last modified date and user to provide model documentation for audits, regulators, internal review and troubleshooting. Learn more here.
This is an example of the Product Variables tab on the export.
The ‘Export Documentation’ button is found in the ‘Go To’ Menu of the Model Development Module.
Multi-Factor Authentication
Slope users can now setup multi-factor authentication (MFA) without having to be on Single Sign On. To configure MFA, click the user menu in the top right of the application > Administration > Privacy and Security tab.
Clicking the Set Up button found on the Privacy and Security tab will walk you through enabling MFA.
New API Endpoints
Copy Projection Endpoint: Allows users to copy an existing projection ID instead of having to create a projection template.
Get Decrement Table Endpoint: Allows users to get the decrement tables on their model including the ID, name, type, improvement year and select period frequency.
Read more about the available Slope API Endpoints here.
Enhancements
Use Annual Effective Rate for Short-Term Interpolation on Scenario Tables
Users can now specify how the short-term spot rates (durations 0-5 months) on scenario tables are calculated. In the past, the short term interpolation method was always from zero. Now users can select to interpolate from zero or use the annual effective rate.
All existing scenario tables will remain set to ‘from zero’ but newly created tables will have ‘Use annual effective rate’ selected by default.
NOTE: This parameter will be added to the Post and Patch Scenario Table endpoints on the API in the future. In the interim, the API will default to using the annual effective rate for the short term interpolation method.
Additional Enhancements
A model copy performance improvement was made to reduce the time users need to wait for their model to finish copying.
Only the headers and elements with errors on the validation details screen will show in red to prevent users from thinking there are errors on objects that do not have any errors.
The model point default value will be used when the column does not exist in the model point file and the field is not required on the model point file definition.
Fixes
API users will no longer get a 500 error when uploading the same model point filter on two products at once.
Resolved a ‘No data table found’ error on some projections with long running static products.
Resolved a ‘Failed to start’ error on projections when the scenario structure does not have any yield curve points on it.
Resolved a model copy issue that was resulting in the copy hanging when projection templates were included.
Data table headers are no longer case sensitive on import.
Extra columns in a file are again being ignored when uploading a data table.
High Performance Mode Available for Projections with New Business
High Performance Mode (HPM) now supports projections that include New Business so that users can dynamically issue new sales (model points) in their projection when running in HPM. For more information on High Performance Mode and which projections are supported, visit our support article here.
Users will now be able to select a Sales Allocation on their portfolio when running in High Performance Mode.
Enhancements
Variable List Now Shows Error Count
Users will now see an error counter at the top of the variable list to indicate the number of variables that have errors on them.
API Update: GET Projection Endpoint Additions
API users will now be able to get the following portfolio and product information from the GET Projections endpoint:
API Update: GET Data Tables/List Endpoint
API users will now be able to get a list of data tables either for a specific table structure or model ID. Learn more on our API documentation page.
Reporting: Repeat Row Labels
Users can now format pivot tables with multiple pivot rows to repeat row labels within their workbook element.
Found under the Element Format (brush) icon. This screenshot shows a pivot table without row labels repeated.This screenshot shows a pivot table with the row labels repeated.
Reporting: Placeholder Text in Control Elements
Users can now customize the placeholder text for any input-based control elements (List Values, Text Input, Number Input, Date, and Date range) to provide context about the expected input.
Select your element > Element Format icon (brush) > General and update the Placeholder field
Merge Differences in Tags on Variables
The model governance module will now show tag differences between two variables (with the same name) and allow the user to merge the tag to the target variable.
Fixes
Debug view is now updating the formula with a different formula per array value for the second dimension of 2 dimensional arrays.
Reduced Failed to Start Errors resulting from AWS request denials.
Improved run log and debug tab loading performance.
Again showing ‘Out of Memory’ message when a projection runs out of memory while finishing the inserting of results.
Model point filters will apply the correct filter field when duplicating a projection and filtering on a field that is not the first field.
Variables only referenced by a sales allocation variable will again display in the output.
Now showing the correct result for projections run in Cores when forward projecting a company array variable with a Single Value (formula) aggregate that relies on a two dimensional aggregate variable.
You can now re-run a projection using a new model. This is often done to try and reproduce or compare results after making updates to a model copy. When switching a model, Slope will attempt to map the settings, scenario table, variable scoping controls, portfolios, sales allocations, investment strategies, products and data tables using the name. Learn more here.
Enhancements
Mass Merge Decrement Tables
The governance module now allows users to select multiple or all decrement tables from one model and merge them into another mode.
Miscellaneous
The target model in the governance module will now show the full name upon hover.
Fixes
Assumption sets will again allow the user to view and change the table selected in the assumption set.
Debug view will no longer erroneously show ‘No Result Available’ when a result is available.
Corrected an issue in which an error message was not providing the correct error source for a Calculated Range where the start and end values were matching.
Debug view is now showing products that are not directly configured on a portfolio (e.g. investment products)
A behind the scenes update to data tables was made to improve performance loading data tables, copying models with data tables and running projections with data tables.
Product Aggregate performance improvements have been made to High Performance Mode (HPM) projections to help further reduce runtimes.
Improved performance of Core projections with very large arrays.
Two-Dimensional Array Enhancement
Two-dimensional arrays can now be created with a product level data table array and a product output grouping array.
Fixes
The ‘Always Calculate’ setting is now staying enabled when the ‘Global’ variable setting is enabled.
Switching the static array used in a two-dimensional array is now updating the array value tabs for a formula using the array and set to ‘formula per array value’.
When a variable directly references a two-dimensional array there will no longer be an erroneous ‘Invalid Array Aggregation Type’ error message.
Using a product data table array in a two-dimensional array will no longer result in a projection error.
The Governance module is now detecting different dimensions for two-dimensional arrays.
When the result of a complex array lookup cannot be determined in the debug view, we are again showing ‘??????’.